TejasJava Overview
Features of the Java language such as platform-independence, rich set of libraries and automatic memory management have made it the favorite programming language amongst software developers. Today, there are millions of Java applications. In order to study the performance of these applications on a particular architecture, we require a simulator which can simulate Java programs.
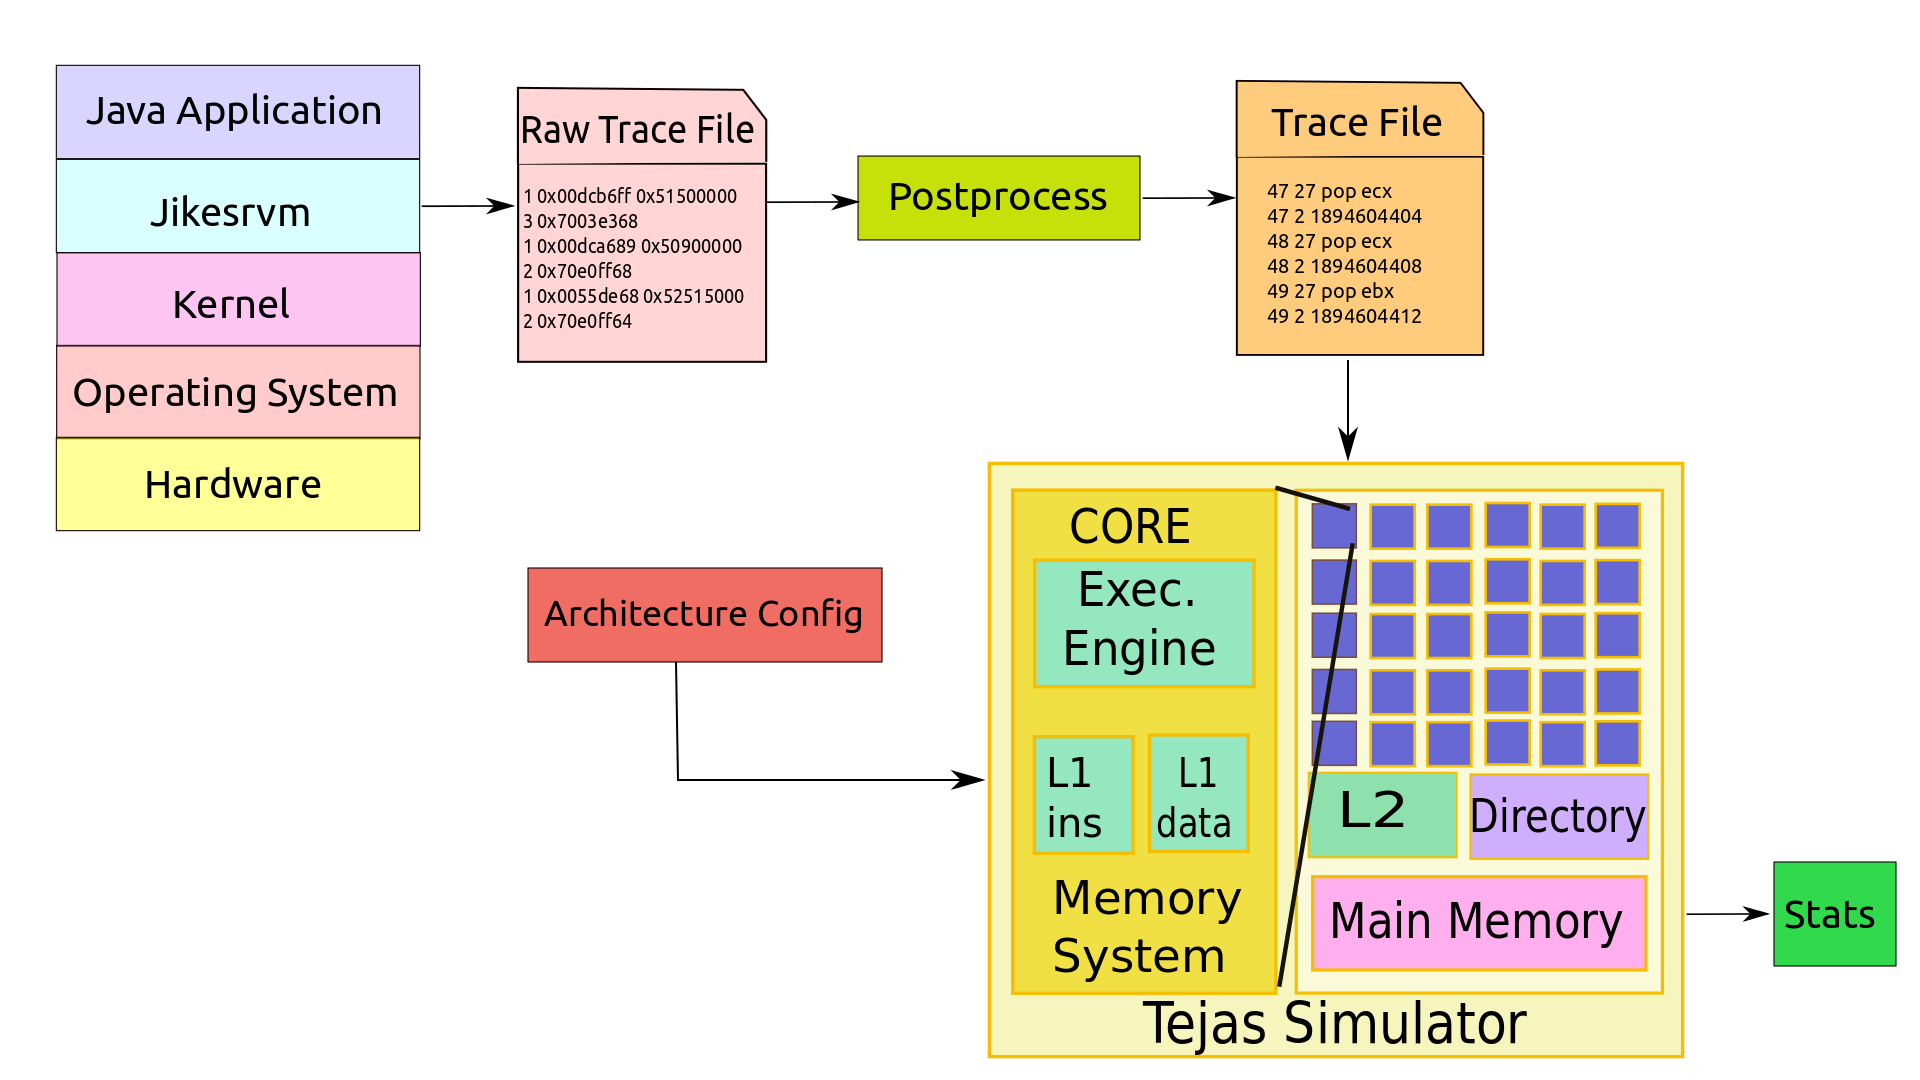
A Java program is dynamically compiled and run by the virtual machine and not directly by the hardware. To the external world, the Java program and the virtual machine are represented by a single process. Thus, to collect the execution traces of a Java program, we need to distinguish between the virtual machine and the program trace. There is no publicly available tool for collecting Java application traces, and TejasJava fills this void. Our approach to obtain traces is to augment the virtual machine and instrument the program running on it. In this work we have used Jikesrvm, an open source research virtual machine developed by IBM.

A Java class file is given as an input to the simulator. We use an instrumented version of Jikesrvm to run the Java bytecode, and generate the trace file containing dynamic runtime instructions. These trace files primarily contain information regarding the x86 instructions being executed and the virtual instruction pointers. The execution trace additionally contains the memory addresses accessed by an instruction. We also embed some metadata in the trace file. The metadata lists the instruction type and the thread id in the case of multithreaded programs. The traces generated by Jikesrvm are in a binary format. To run these traces on the architectural simulator Tejas, we require traces in different format (instruction set of Tejas). Therefore, we need to postprocess, these raw traces into x86 instructions. We use the udis86 library for this purpose. libudis86 is a disassembler library for the x86 architecture, which decodes a stream of bytes as x86 instructions. These traces are subsequently compressed to reduce the size of the files.
To calculate the dynamic memory used by the program, we implemented a hardware reference count garbage collector in Tejas. The execution traces have information about the memory allocated to the object and the reference updates. The new operator in Java instantiates a class by allocating memory for a new object and returning a reference to the allocated memory. To get this information we insert the markers in benchmarks and these markers are also visible in execution traces. With the help of these markers we get the information about the memory addresses allocated to the object and reference updates. The traces are post processed to mark the addresses of the objects, which will be managed by the hardware garbage collector. The hardware garbage collector maintains the reference count of the objects. When an object is created, its reference count is one. When a new reference to the object is created, the reference count is incremented by one. And when the reference is deleted, the reference count is decremented by one. The memory space can be reclaimed when object reference count becomes zero. The markers in the annotated benchmarks are captured in the trace file and special instructions for allocation, incrementing and decrementing reference count are inserted in the trace files.
We have evaluated our framework on Dacapo 2006-10-MR2, Java Grande and JOlden Benchmark Suites.
